.
Unlock powerful insights when Agilebase is your core system
Agilebase gives you more than just data — it gives you the autonomy to see data how you need to see it, so you get the clarity you need for your business.
Whether you’re tracking performance, analysing trends, or planning for the future, our intuitive reporting tools help you turn raw information into actionable insights.
With a suite of flexible, no-code features, Agilebase empowers every team to build reports that work the way they do.
Adapt fast with development mode
Need to tweak a report or view? Do it live in development mode — test filters, adjust logic, and update instantly without disrupting operations. We understand as business needs evolve, as do your reporting requirements. Don’t wait for IT to create your reports – get answers instantly with Agilebase. And it doesn’t stop there, with the right permissions, you can empower your managers and teams to create their own reports too!
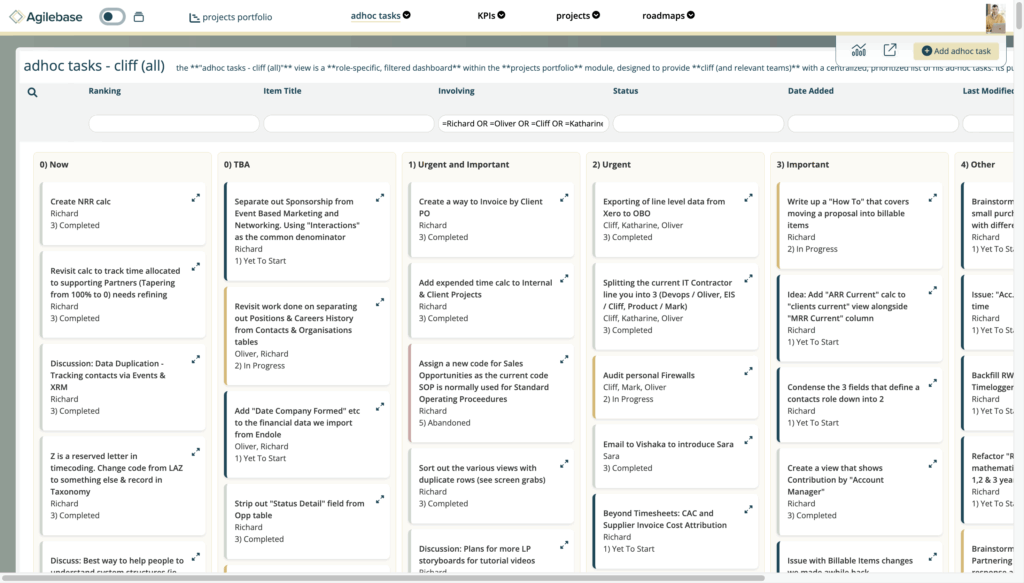
Views: Tailored perspectives on your data
Start with views — your foundation for reporting. Views let you filter, sort, and group data exactly how you need it. Whether you’re segmenting customers by region, tracking overdue tasks, or isolating product performance by quarter, views make it easy to focus on what matters.
- Build custom filters to narrow down records
- Group data to identify trends at a glance
- Use saved views for quick access to frequently-used reports
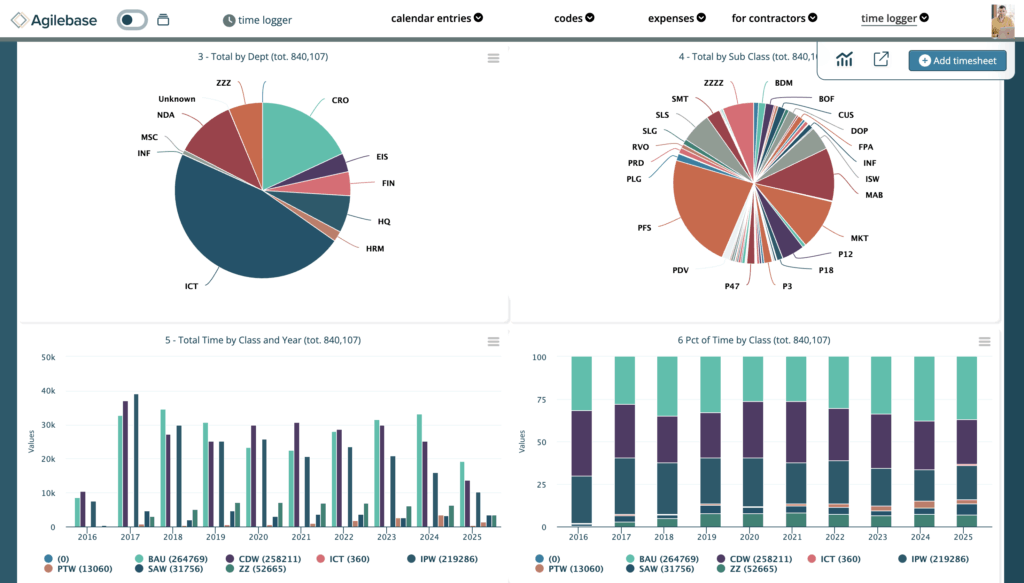
Charts: Visualise trends and patterns
Turn numbers into insights with charts. Agilebase supports a variety of chart types, including bar, line, pie, and stacked charts — perfect for visualising KPIs, sales over time, product mix, and more.
- Drill down into data points for deeper analysis
- Display charts in dashboards or export for presentations
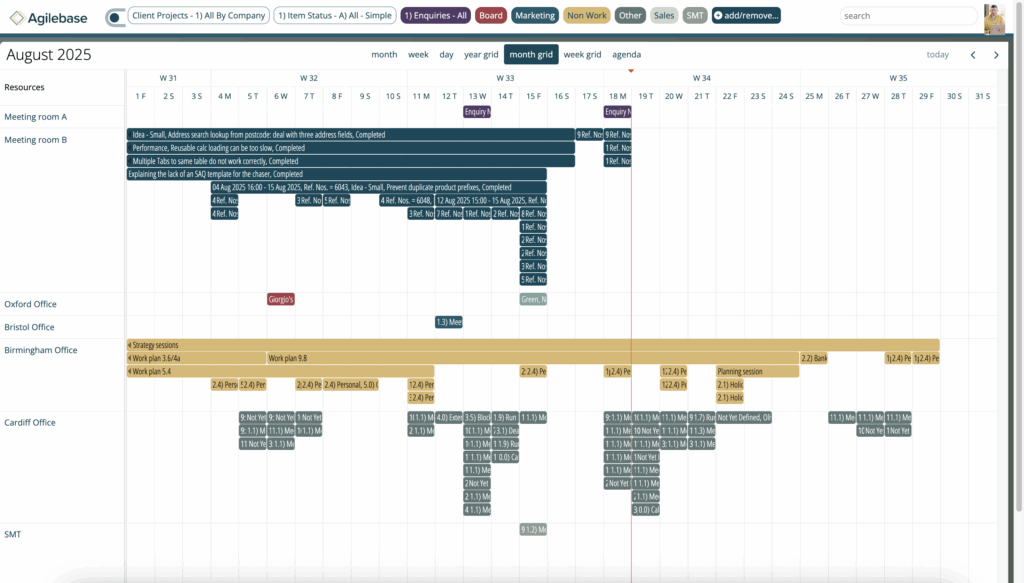
Calendars: Report by time, for your unique business needs
With calendar views, reporting on timelines becomes seamless. From project milestones to staff availability and room management. Agilebase helps you see your data in a time-based format.
- Perfect for resource planning, task scheduling, and event tracking
- Visualise deadlines, appointments, or events by day, week, or month
- Sync with other calendars such as Google
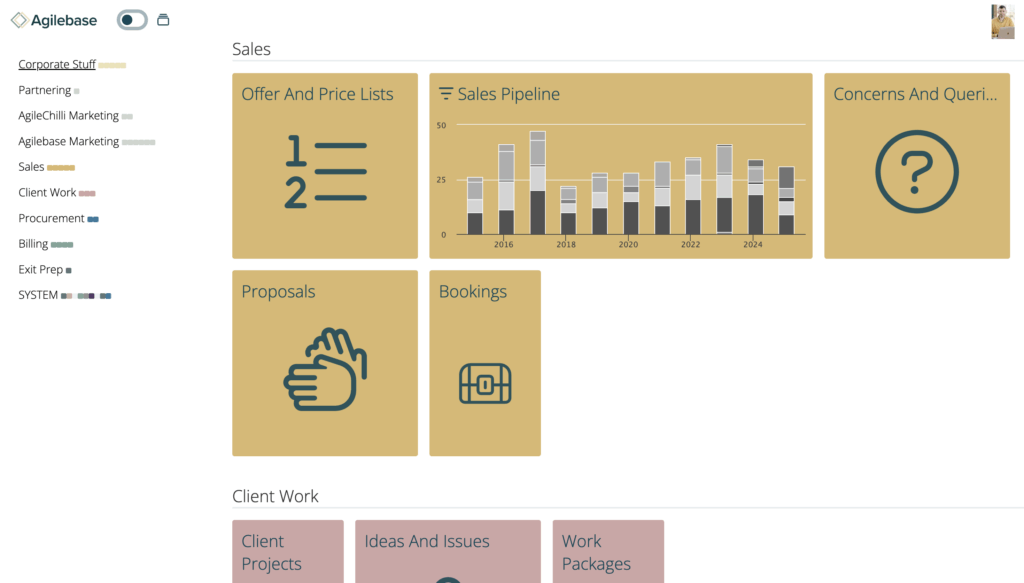
Tiles: Build dynamic dashboards
Create engaging dashboards using tiles. Tiles can display metrics, charts, alerts, or quick links — perfect for at-a-glance updates and live monitoring.
- Personalise dashboards for different roles or departments
- Combine multiple report types into one visual hub
- Add real-time status indicators for rapid decision-making

Integrations: Consolidate reports from Agilebase and other software
Get one version of the truth. We understand departments have their favourite apps which do a specific job they need – such as Xero. Agilebase has an open API so can be integrated with these third party platforms.
- No need to manually cross check data, simply view one version of the truth through Agilebase
- At the enterprise level, reporting tools like Tableau, Power BI or Preset can also be used to consolidate data from Agilebase plus many other sources.
- Export PDF or excel reports in just a few clicks for ad-hoc sharing
Make the right decisions, with data your way
With Agilebase, reporting isn’t a chore — it’s a strategic advantage. No waiting on IT. No outdated spreadsheets. Just answers.
Whether you’re a data expert or just getting started, you’ll have the tools you need to build reports so you can make the best decisions for your business.
.