The Plan D pricing plan, typically used for more extensive systems and/or larger customers includes the option to run your dedicated server, but what does this mean?
Summary
In a nutshell, it means, if you have a large scale, high traffic system, you can effectively monitor and maintain this to reduce downtime and improve performance, with automated alerts and AI-powered suggestions.
Details

For typical workloads, Agilebase runs as a multi-tenanted system, that is, multiple customers share the same server(s), as is the case with most other SaaS (software as a service) platforms.
However, the Agilebase platform does offer No-Code developers an extreme level of bespoke application-building capability. Whilst you can start simple, you can also create really complex formulas, heavy duty workflows, highly scalable API endpoints and complex interconnected database structures. Build high – there’s no ceiling.
To manage such a large scale application, or collections of applications, the key is monitoring. That’s what the dedicated server option gives you.
Physically, it just means that we extract your Agilebase application server and put it on its own Virtual Private Server (VPS), separate from other customers, so that you can control it fully. That allows you to
- should any problem occur, be able to restart the system whenever you choose
- monitor the performance of every aspect of the system
Number 2, monitoring, helps you identify and resolve complex application issues quickly.
If your application slows down, what’s the cause? Is it a third party application swamping the system with API calls? Has a particular view been made slow due to the addition of a complex calculation? Has a large amount of data been imported? Are any of these things having impacts on other parts of the system?
Modern monitoring tools can help answer these questions and more.
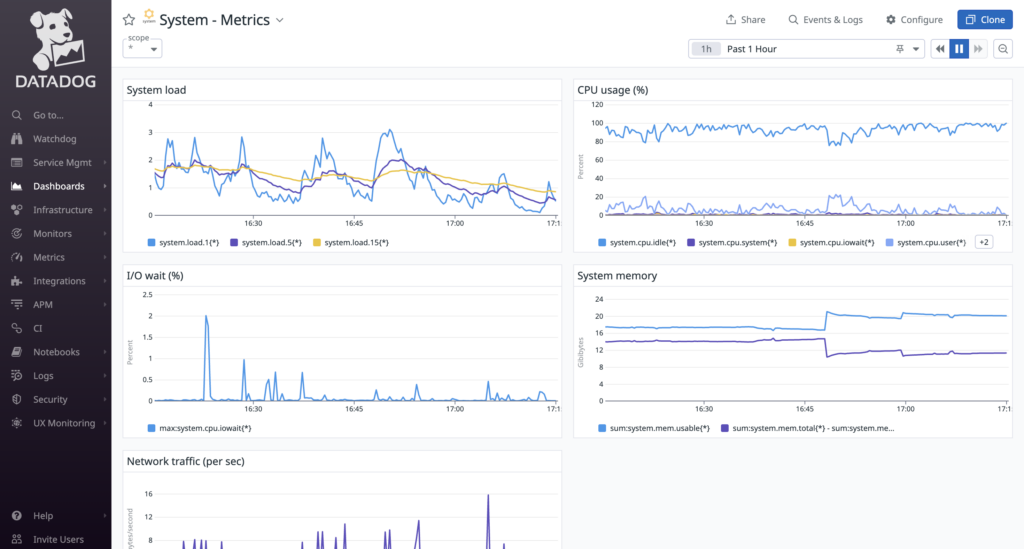
We provide an appropriate set of third party tools to allow customers to troubleshoot and examine their systems. This is always evolving, but currently we are primarily using Datadog and investigating Coroot.
The current list of capabilities* are
- Infrastructure monitoring – tracking memory use/CPU use (total & per process), disk space, network traffic etc.
- Log management – viewing, searching and reporting on time-stamped server logs
- Application Performance Monitoring (APM) – drill down to see details of the application calls being made
- Database Monitoring (basic level) – track database performance and usage metrics over time
* details may change over time
All of these factors can be compared and cross-checked easily, to aid in figuring out the root cause of issues. Increasingly, automated artificial intelligence capabilities are also leveraged for this purpose.
Having these statistics available, separated out for your system only, also aids support should you wish to get in touch with us with any questions or problems.
Note: the Agilebase infrastructure consists of many different servers/services, from file storage to database to front end web server. The ‘dedicated server’ discussed here is the primary application server, not these other components, which are less affected by individual customer usage. In addition, some monitoring at the database level is included.